Errors like JavaScript exceptions or XHR failures are one of the biggest challenges that come with developing websites or frontend-driven web applications. Why? Because writing good code is hard. And keeping track of client-side errors is even harder.
If there are no errors in my developer console, there aren’t any at all.
You may have heard this assumption—or you even made it yourself? However, especially when using non-trivial JavaScript in your code base, simple issue reports like »the link doesn’t work« aren’t sufficient to find and reproduce the problems. Too few applications and websites are logging JavaScript errors.
Fetching errors
When a JavaScript runtime error (including syntax errors and exceptions thrown within handlers) occurs, an error event is fired at window and window.onerror() is invoked. Thus it makes sense to implement a custom window.onerror callback that captures, processes, and stores those errors. As there may be an other window.onerror callback defined already, it’s recommended to override/extend the callback function instead of replacing it in order to execute the error reporting before the existing function.
// Store the original error handler callback function
const originalErrorHandler = window.onerror;

// Do something with the error object
const reportError = (body) => {
  // Do something
};

// Override the global error handler
window.onerror = (errorMessage, url, lineNumber, columnNumber, errorObject) => {

  // Report the error
  reportError({
    type: 'Error',
    message: errorMessage,
    url: url,
    line: lineNumber,
    column: columnNumber,
    error: errorObject
  });

  // Run the original error handler callback (in case it is a proper function)
  if (typeof originalErrorHandler === 'function') {
    return originalErrorHandler(errorMessage, url, lineNumber, columnNumber, errorObject);
  }

  return false;

};
It’s worth mentioning that while window.onerror has been available in browsers for quite some time, almost every browser implements window.onerror differently regarding the amout of arguments that are sent to to the listener function as well as the structure of those arguments.
Now that JavaScript exceptions are covered and logged, you may want to log XHR failures as well. While you still should log any kind of error within your APIs separately within the backend, logging XHR failures within the clients may be especially useful when you’re not in control of endpoints you’re using (e.g. external APIs).
fetch('/xyz').then((response) => {
  if (!response.ok) {
    reportError({
      type: 'AJAX',
      url: response.url,
      result: `${response.status} ${response.statusText}`
    });
    return Promise.reject(response);
  }
  return response;
}).then((response) => console.log('OK')).catch((error) => console.error('Error', error));
Keep in mind that you probably want to create a generic error handling function you can use for all of your fetch() calls in order to keep this code DRY and reusable.
const handleErrors = (response) => {
  if (!response.ok) {
    reportError({
      type: 'AJAX',
      url: response.url,
      result: `${response.status} ${response.statusText}`
    });
    return Promise.reject(response);
  }
  return response;
};

fetch('/abc').then(handleErrors).then((response) => console.log('OK')).catch((error) => console.error('Error', error));

fetch('/xyz').then(handleErrors).then((response) => console.log('OK')).catch((error) => console.error('Error', error));
Transmitting errors to your server
Any logged error information shall be transmitted and stored somewhere (e.g. a local endpoint on your very own server) for further analyses, of course. In order for this to work, you’ll need to set up some kind of reporting web service that will accept your error data over HTTP and log it to a file or store it in a database. This may be achieved easily by using XMLHttpRequest (e.g. via the fetch API).
const reportError = (body) => {
  fetch('/api/errors', {
    method: 'post',
    body: JSON.stringify(body)
  });
};
Transmitting errors to Google Analytics
Implementing an own endpoint for storing, interpreting, and displaying errors may be difficult to achieve or even impossible due to restrictions integrating yet another tool. Google Analytics provides a special API for storing exceptions as well, allowing you to measure the number and type of crashes or errors that occur on your property within the Google Analytics dashboard. All you need to do is adjust the aforementioned reportError function.
const reportError = (body) => {
  if (window.ga) {
    window.ga('send', 'exception', {
      exDescription: Object.keys(body).map((key) => `${key} = ${JSON.stringify(body[key])}`).join(' | ')
    });
  }
};
At the time of writing Google Analytics does not provide any built-in report surfacing that information. Therefore you need to add a custom dashboard/report to be able to actually display these errors after setting up the logging. To do so, create a new (blank) dashboard or use an existing dashboard of your choice.
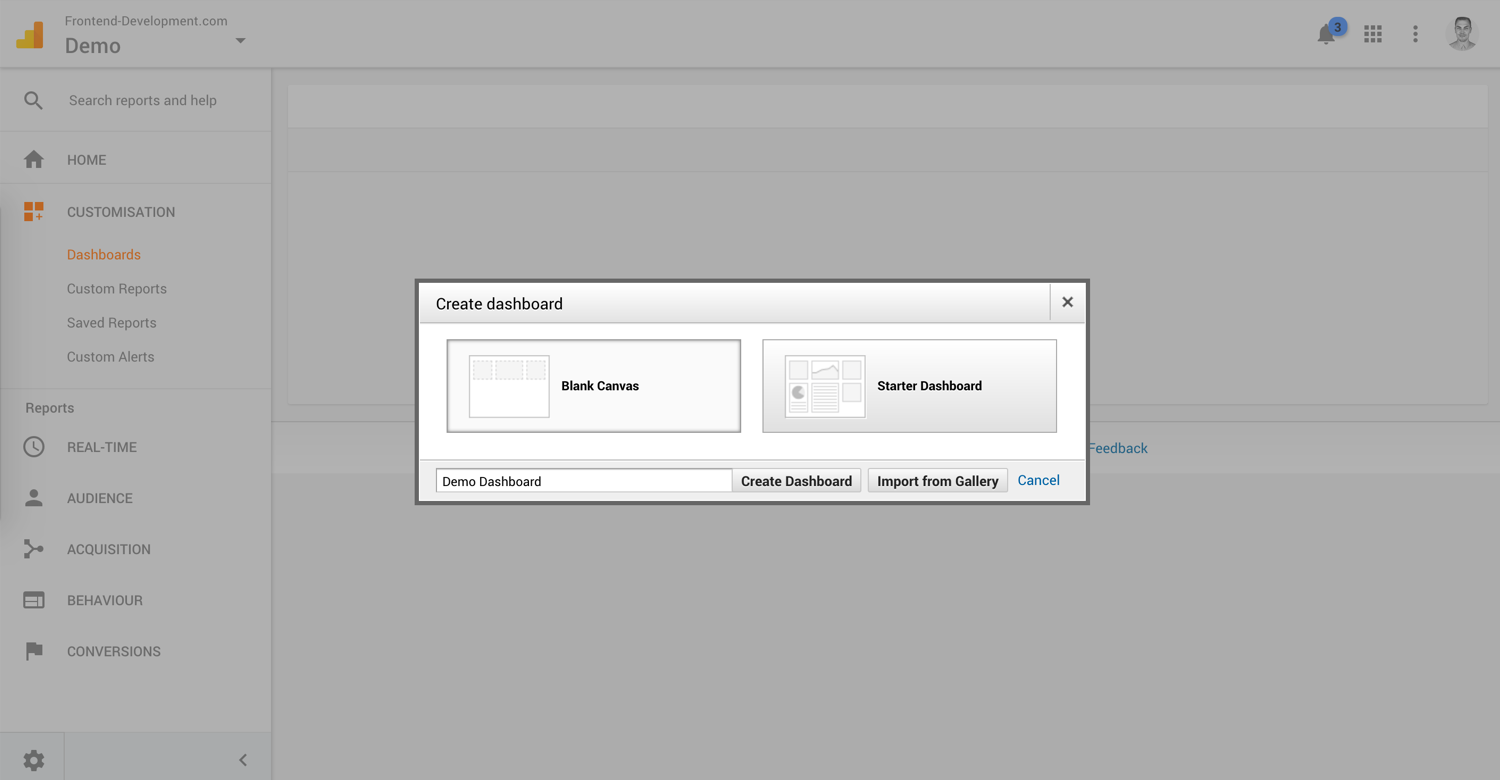
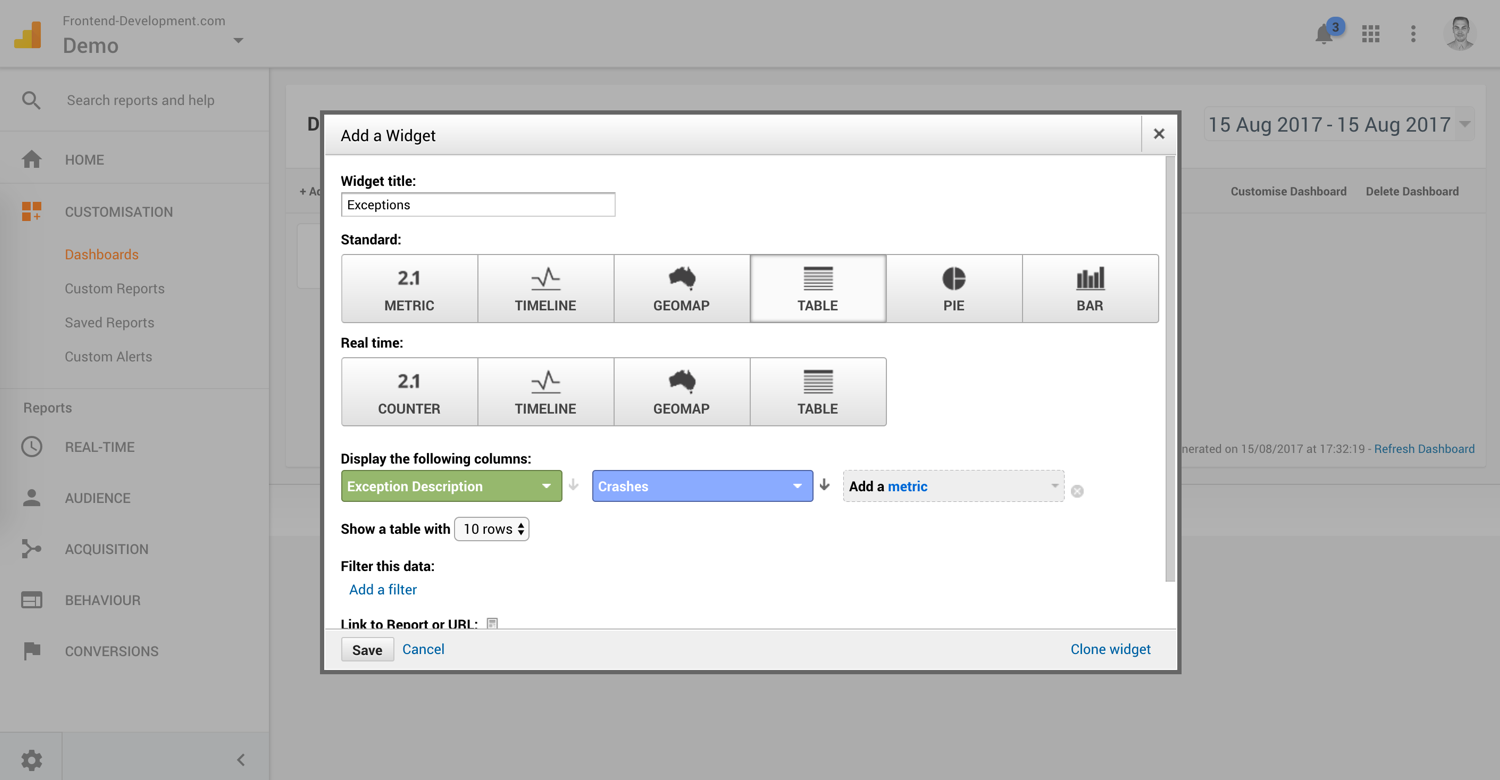
Add a new widget within that dashboard that displays »Exception Description« as a dimension and »Crashed« as a metric.
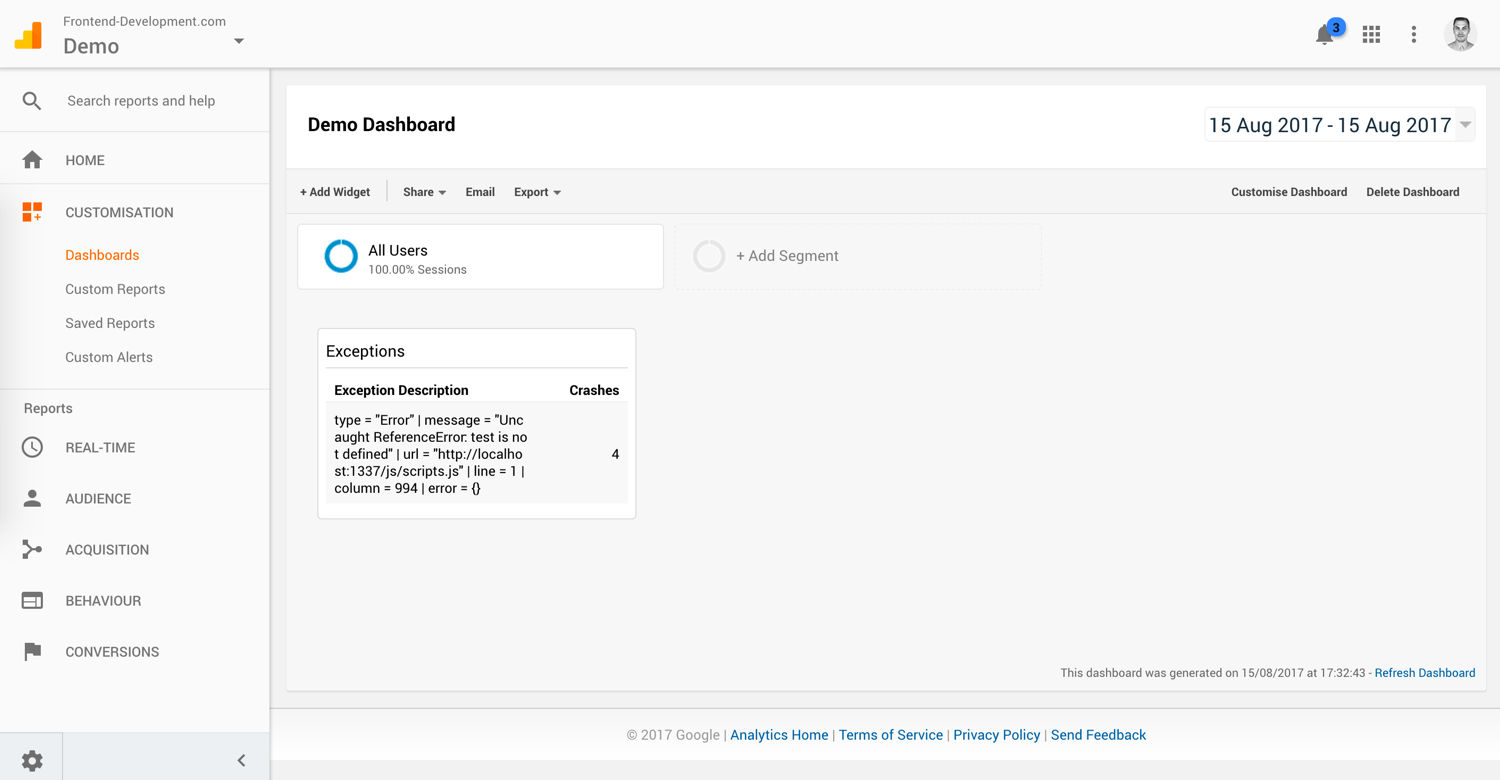
This way you get a nice little overview of exceptions happening within your website or application.
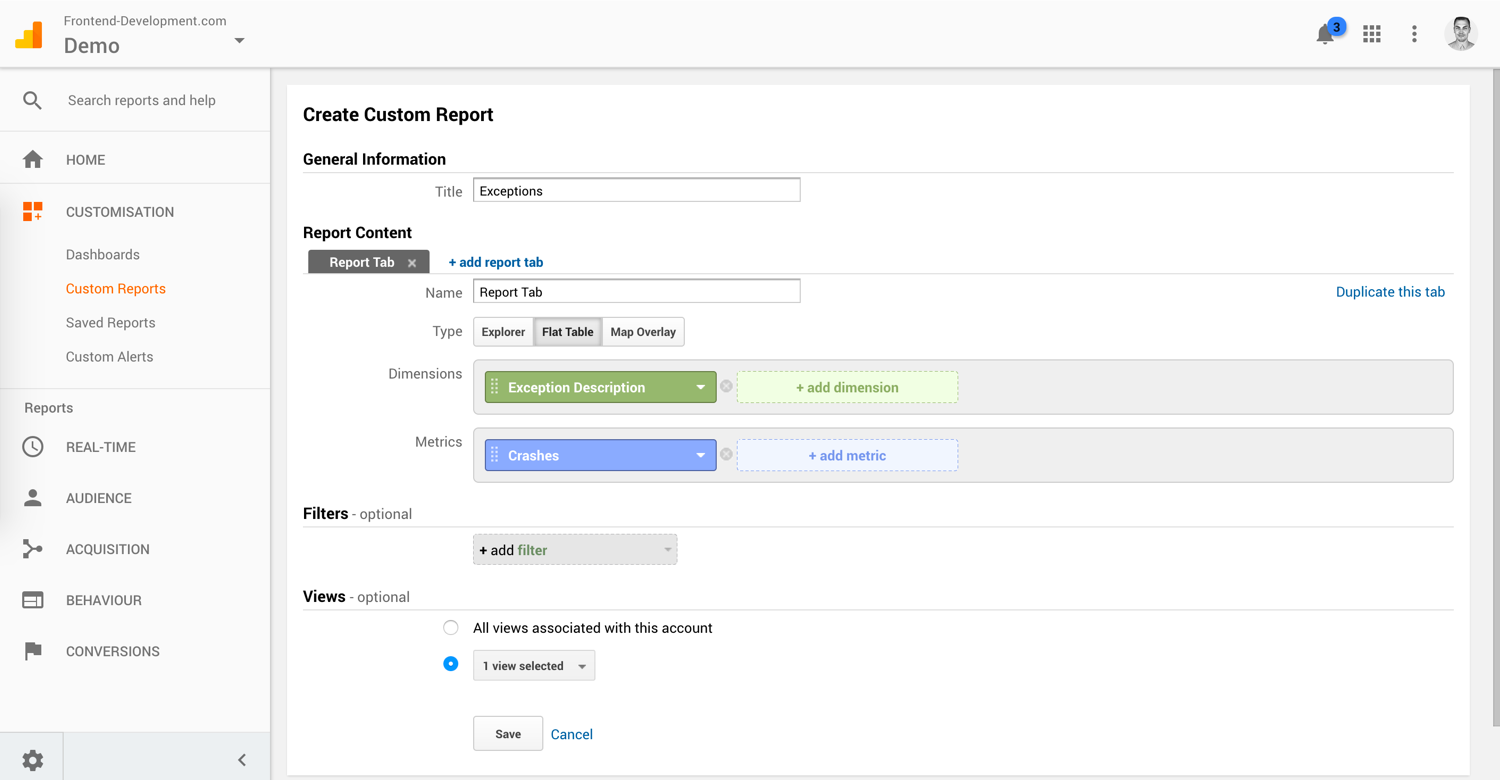
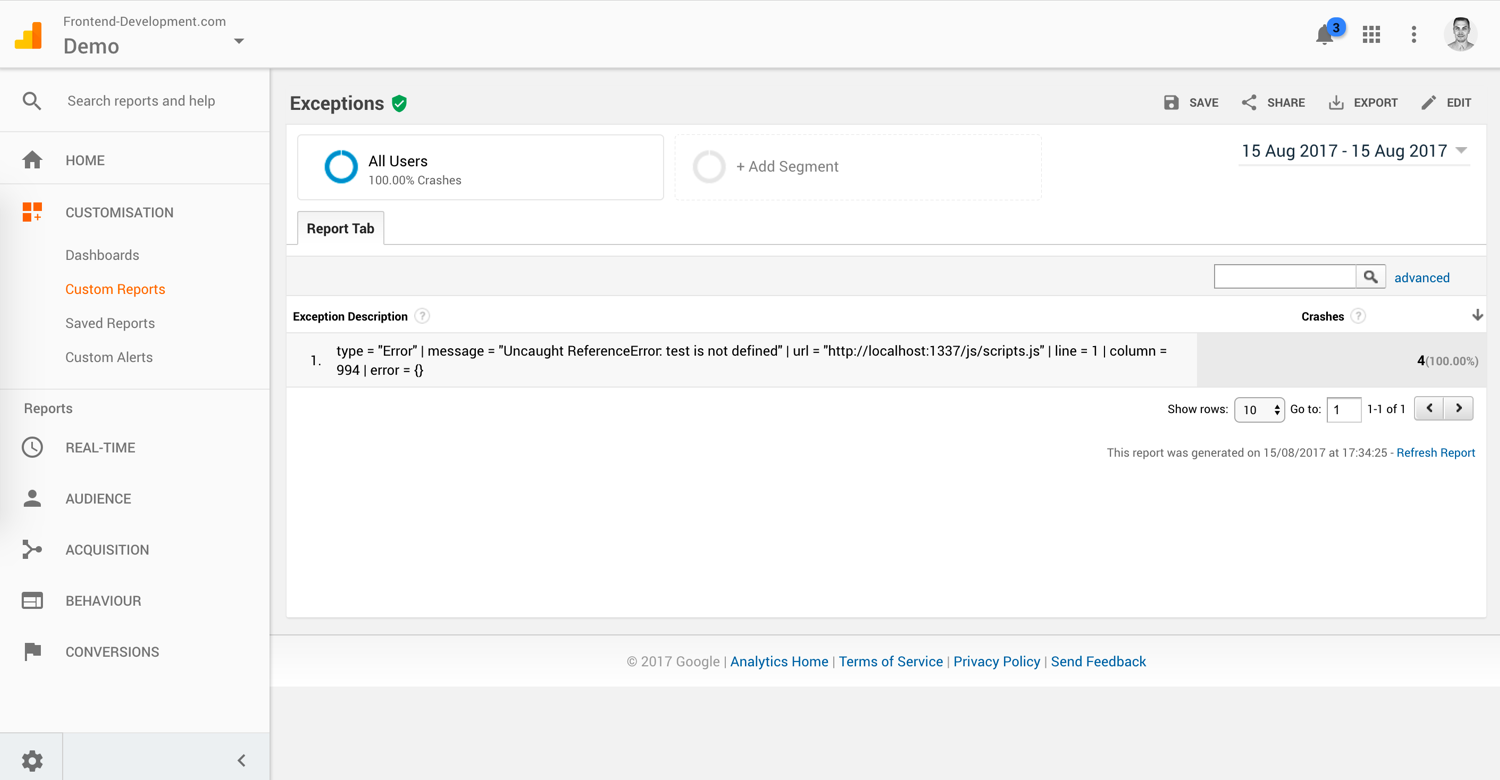
You can also go to the »Customisation« tab and create a custom report to give you a flat table of errors.
Conclusion
You can test that everything is set up properly by opening your browser’s developer console and typing throw new Error('Test'), then checking your endpoint (respectively your custom Google Analytics report a few minutes later) to make sure your error is logged.
There may be not too much (valuable) information and a lot of noise instead as browsers report the same errors differently and you need to take care of merging errors from different users, browsers, languages (Internet Explorer actually reports error messages in the browser’s language), and URLs. None of these problems are unconscionable or unsolvable, though. Just something to keep in mind.
The days of not logging client-side JavaScript errors are over.